

I’m teaching a course on quantitative methods, R and archaeological data and my students have to realize their own project in that course. That means they ask me a lot of very sensible questions. Here I will write about workflows I find useful as documentation for the future. First things first: Data wrangling!
I told my students to never put more than one information into one column when creating a table, because that’s just bad practice. Now, a lot of them gather data that is cumulative, which means there are several values which can belong to one variable at the same time (e. g. burial gifts per grave, animal figures per petroglyph, …). So inevitably the question pops up: Do I *really* have to create a seperate column for each of the possible values? There are more than xx different values, but of course each of my units only has max. three of them! This is so tedious!
And they are right. It really is tedious and easy to loose track of things, if the spreadsheet they are developing gets too big and unwieldy.
Because I am not a data wrangling expert myself, I had to sit down and work through tidy-R-vignettes to get a hang of this. Now here is my workflow to creating long and wide tables according to need from cumulative values in one column seperated by comma.
First things first. We will need the library tidyr:
library(tidyr)
Now, let’s create a very creative example dataframe:
df2 <- data.frame(x = c(NA, "a,b", "a,b,d", "b,c", "d,a,f,e"))
df2$id <- c(1,2,3,4,5)
1. Separate
As you can see, the dataframe contains several values in one column called x, which are seperated by comma. Also, I added an ID-column. I will now seperate the x-column with just one easy line of code:
df3 <- df2 %>% separate(x, c("A", "B","C","D"))
Here I gave (again very creative) new column names (A, B, C and D). You will need as many as you have maximal different values in one field of the column. Of course loads of NAs are being created and my dataframe number 3 now looks like this:
    A    B    C    D   id
 <NA> <NA> <NA> <NA>   1
    a    b <NA> <NA>   2
    a    b    d <NA>   3
    b    c <NA> <NA>   4
    d    a    f    e   5
2. Gather
I take all these columns and create rows from their content (I GATHER them). I will need a key, which is the new column name in which the names of the columns I now have (A, B, C, D) will be put and a value, in which the values of the old columns find their place. Also, I put na.rm is TRUE, because I don’t need rows with no values. I am creating a long dataframe with this function. The IDs will help me to keep track of everything:
df4 <- df3 %>%
 gather(key = "placenr",
 value = "example",
 "A", "B","C","D",
 na.rm = TRUE)
  id placenr example
  2       A       a
  3       A       a
  4       A       b
  5       A       d
  2       B       b
  3       B       b
  4       B       c
  5       B       a
  3       C       d
  5       C       f
  5       D       e
Now, I wasn’t interested in which place my value was entered in the column, so I can simply change that to a 1:
df4$placenr <- 1 # the whole column just contains 1s now
Look what it looks like now!
 id placenr example
  2     1   a
  3     1   a
  4     1   b
  5     1   d
  2     1   b
  3     1   b
  4     1   c
  5     1   a
  3     1   d
  5     1   f
  5     1   e
3. Spread
So this was the long format. To create a wide format, which makes column names from my example and puts the 1s where they belong, I just need to SPREAD the data. Again, I will need a key (new column names) and a value (new columns’ values). The key will be the information, which at the beginning had been entered cumulatively into one column. The value is that they exist (my 1s in the column placenr).
df5 <- df4 %>% spread(value = "placenr", key = "example")
And here we are:
id  a  b  c  d  e  f
 2  1  1 NA NA NA NA
 3  1  1 NA  1 NA NA
 4 NA  1  1 NA NA NA
 5  1 NA NA  1  1  1
Aaand that’s the format I would have told them to use when inputting their data. I lost my first entry (ID 1), because it contained no data (just to show you that this may happen).
Is it easier this way? What do you think?
PS: Did you know there are beautiful illustrations by Allison Horst concerning this topic? Have a look!


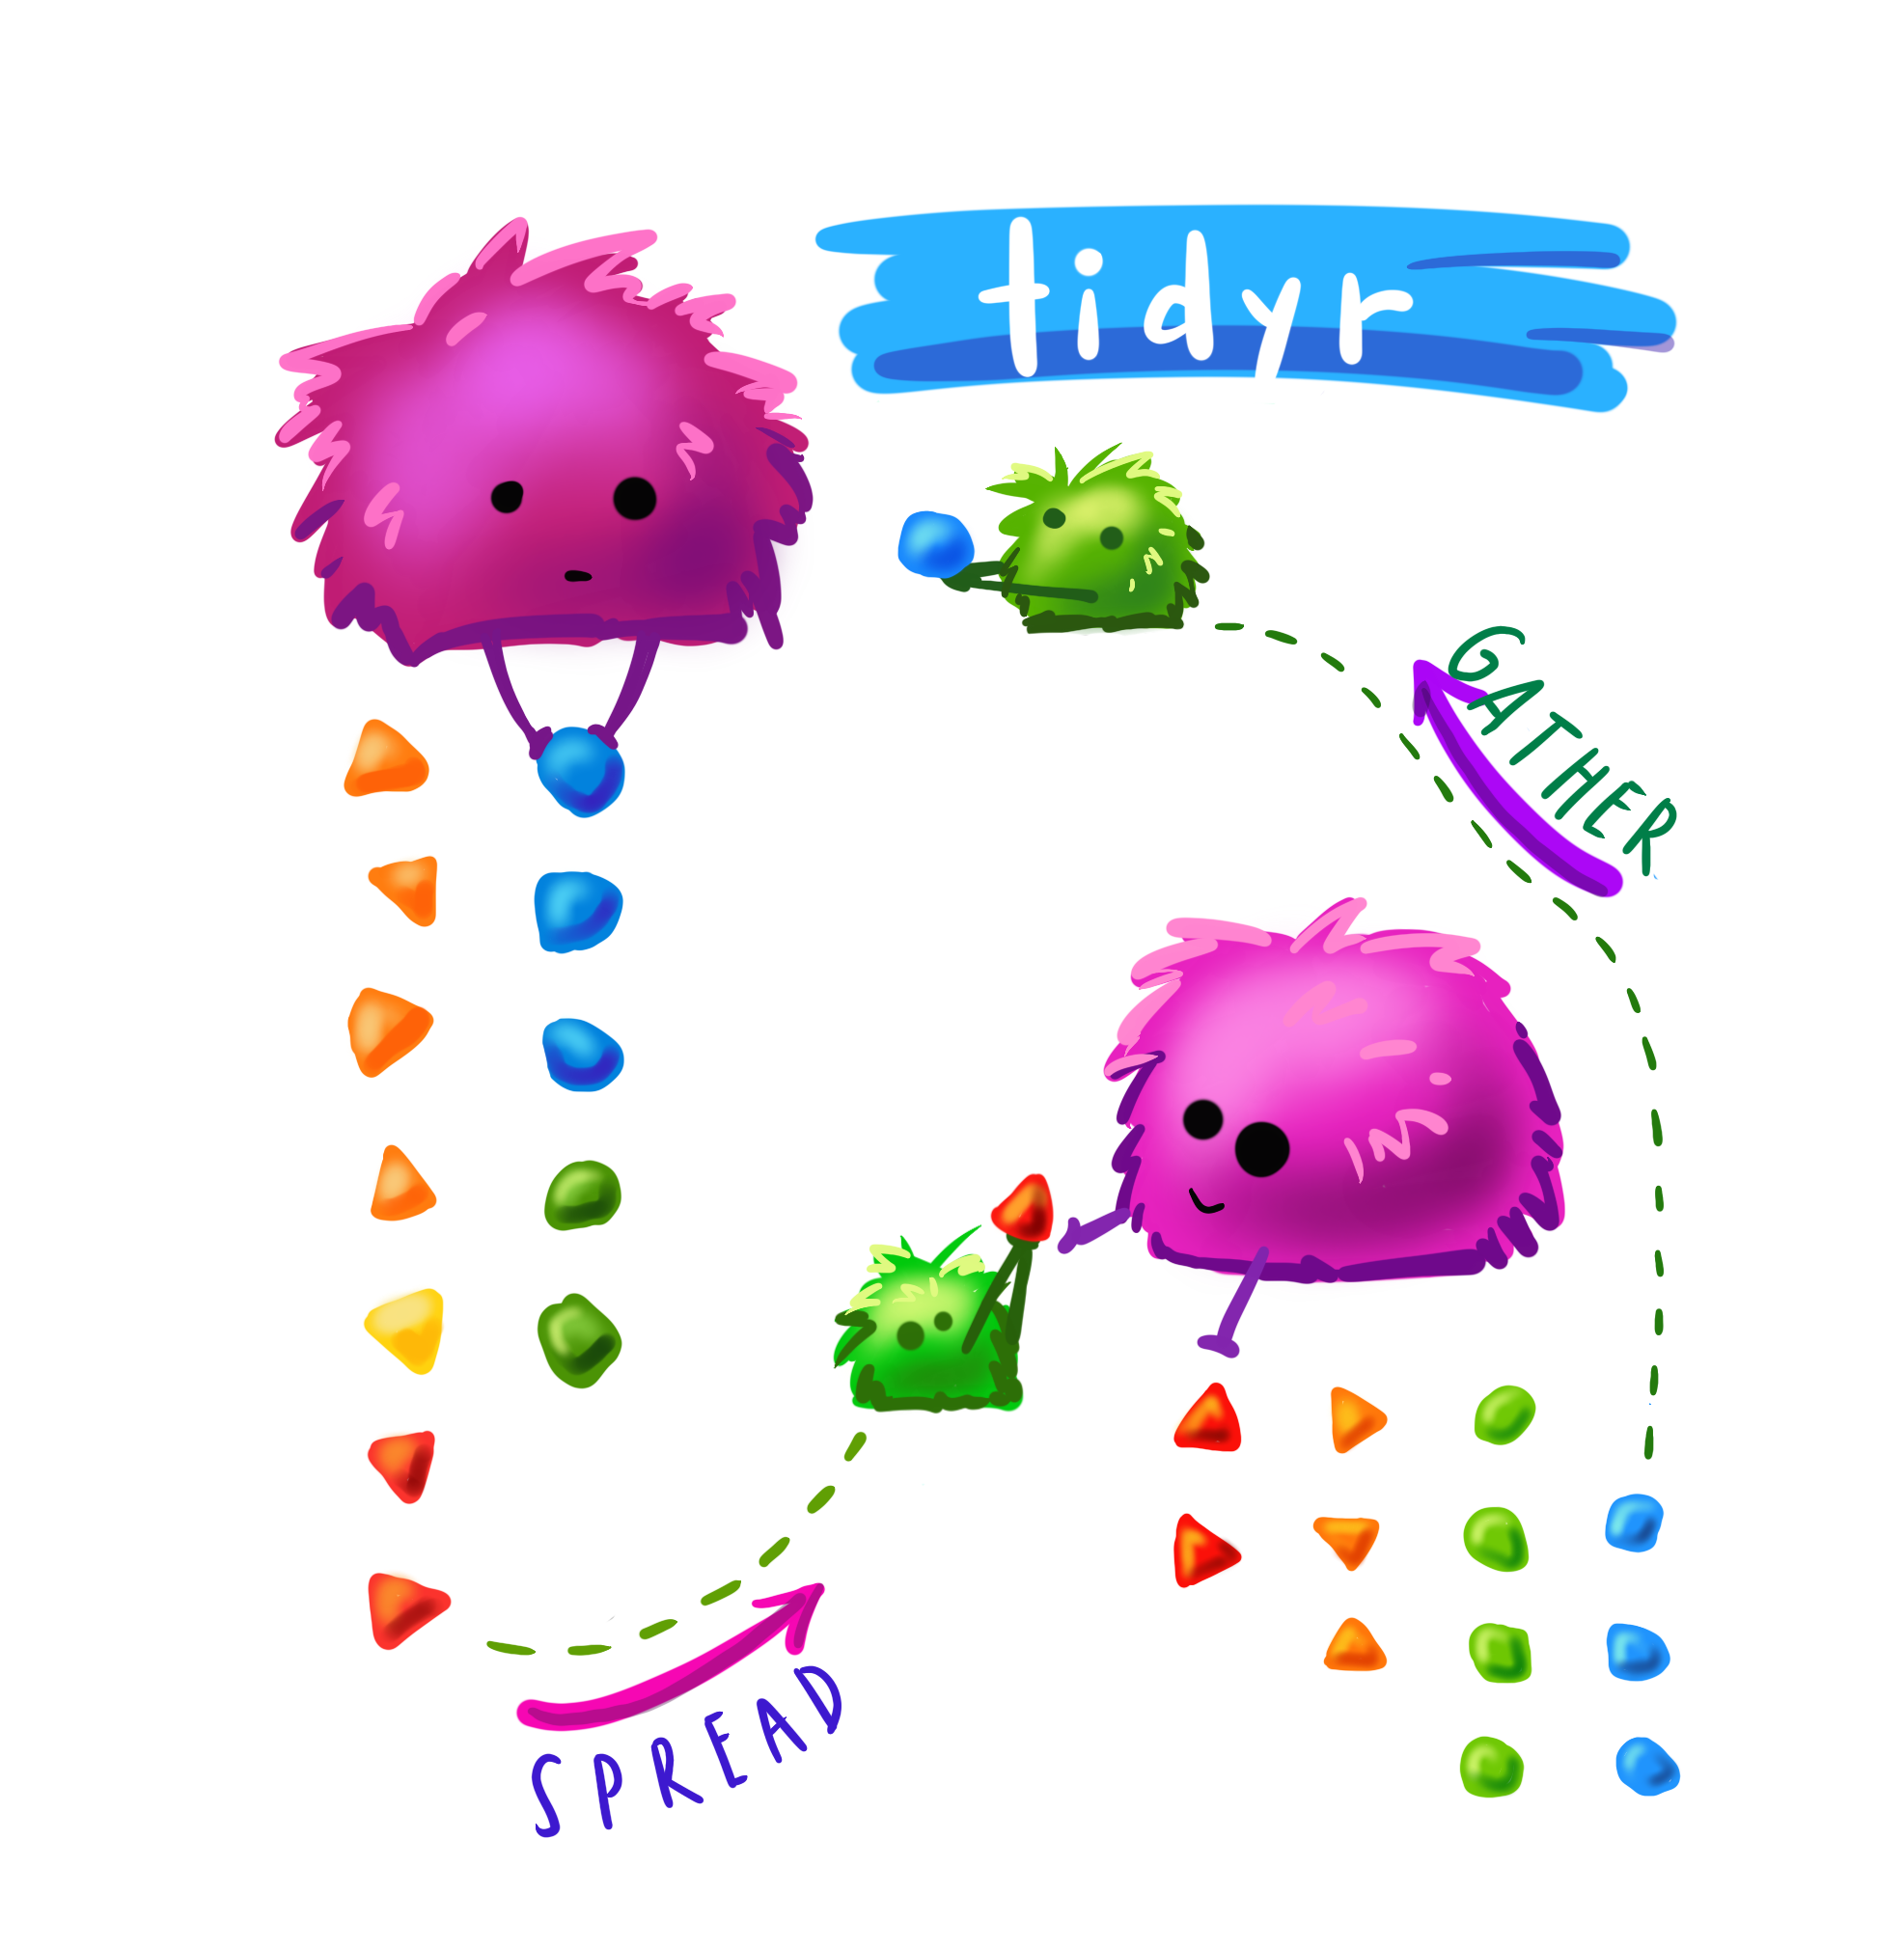